$20 AOV. Policy-risk niche. Zero ad history. Scaled past the operator's capacity in 12 months.
$3,200 in month one.
$200,000 in month nine. Built from zero.
Nerdused sells Microsoft Office and Windows keys globally. September 2024: $1,009 in monthly revenue, no ad accounts, no pixel data, no conversion history. Software keys is a high-scrutiny niche, pixels get banned, accounts get reviewed.
I built the entire Google Ads channel from scratch: server-side Shopify tracking, 21 campaigns, 5 markets, 8 currencies, scripts managing bids per SKU. Twelve months later: $1.5M gross, 56,758 orders, $200K/month. One operator. No team.
Low-AOV / policy-risk DTC brands. 1-2 engagements per quarter.
The outcome
“We grew too fast. I didn't expect it. I can't handle the customer support anymore , I'd rather sell the business and start a new one.”
Nerdused operator · paraphrased from end-of-engagement debrief, Sep 2025
The store was scaled and sold inside 12 months. A problem most of you would want to have.
What this case study actually proves
- One brand, one engagement, 12 months built from $0 ad history to $1.5M gross. Real numbers, not blended portfolio averages.
- High-risk niche (software keys) that gets pixels banned. Server-side tracking from day one. 12 straight months without an account incident.
- Every metric verified by Shopify Analytics, not platform attribution. The store scaled past the operator's capacity and was sold inside 12 months.
Who this case study is for
- Low-AOV ecommerce ($10–$30 AOV) where 3× ROAS sounds healthy but 1.2× is break-even, you need volume + tight math, not hero ROAS multiples
- Shopify operators in policy-risk niches (software keys, supplements, gambling-adjacent) needing server-side tracking from day one to avoid pixel bans
- Founders building paid from $0 conversion history, no shortcut to Smart Bidding, the right sequence is Manual CPC first, then ML
- Multi-currency / multi-market sellers (5+ countries) where one PMax campaign for 'worldwide' is leaving money on the table
E-commerce since
14+ yrs
Google Ads, GMC, Shopify and server-side tracking
E-com accounts managed
150+
Shopify, headless, custom storefronts, classic platforms
E-com spend processed
€50M+
Across DTC, marketplaces, fashion, software, lifestyle
This case scale
$1.5M
Gross sales · 12 months · 56,758 orders · operator exited at peak
The brief
~$20 AOV at launch (scaled to $26 by year end). You need 10,000 orders to hit $200K. That’s 333 purchases a day.
Low-AOV ecommerce is a different game. Every standard benchmark is wrong. A 3× ROAS campaign sounds healthy, at $20 AOV it barely breaks even. The profitability threshold here was 110–120% ROAS: $1 in spend needed to return $1.10–$1.20. Volume was the only lever. (The 333-orders/day figure above is the launch-math at $20 AOV. As the product mix scaled into higher-AOV SKUs, the actual order count needed for $200K dropped to ~250/day. Either way, volume is the lever.) And volume starts with getting the account live, clean, and trusted by Google from day one.
No history, no signals
September 2024: a store with occasional organic sales and no advertising history. Smart Bidding needs conversion data to optimise. Without it, the algorithm guesses, and at $20 AOV, every bad guess costs money immediately.
Merchant Center: daily fires
Digital software licenses sit in a policy grey zone for Google. Products get flagged randomly, without warning. A disapproved product that stays down for 48 hours is revenue gone. Daily Merchant Center monitoring was non-negotiable, not optional, not delegated.
High-scrutiny niche, clean account required
Software key resellers attract more policy scrutiny than standard ecommerce. Pixel flags and account reviews happen to competitors in this space regularly. We built on server-side conversion tracking from day one. The Google account ran uninterrupted for 12 straight months.
What you should stop doing immediately
Five default setups that guarantee your low-AOV account underperforms.
If you recognise any of these in your current operation, you already know why the channel isn't scaling. None of them are fixable with "better creative" or "smarter bidding."
Skipping straight to Smart Bidding / PMax on day one with no conversion history. The algorithm guesses, and at low AOV every bad guess costs immediately. The right sequence is Manual CPC first, then ML, Manual seeds the data ML needs.
Running one 'worldwide' PMax campaign instead of geo-segmenting per market. CPCs, conversion rates, and margins differ wildly between US, UK, EU, and APAC, one campaign averages them into noise.
Using the default Shopify pixel in a policy-risk niche. Browser pixels get flagged, blocked, or silently broken. Server-side tracking is the only way to run clean in software keys, supplements, or adjacent verticals.
Grouping low-AOV SKUs together in one ad group. Office 365 Lifetime converts at 3× the rate of Office Standard, one shared bid overpays for the slow product and underbids for the fast one. SPAG fixes it at source.
Targeting a 3× ROAS at $20 AOV. Sounds disciplined, kills the business, the math doesn't work at low AOV with thin margin. The right target is break-even +20%, then drive volume.
What the wrong setup costs you at low AOV
Run the math on a typical low-AOV DTC account launching Smart Bidding cold:
- $20 AOV, target 3× ROAS (sounds disciplined) = $6.67 max CPA. At cold Smart Bidding, you'll bleed budget for 60–90 days before the algorithm gets close.
- Pixel ban in a policy-risk niche = 3–6 weeks of zero attribution, audience lists wiped, Smart Bidding starves. Rebuild from scratch.
- One "worldwide" PMax = budget eaten by the worst market in your mix. Profitable UK / US territories subsidise unprofitable APAC tests, you can't see it happening because the campaign averages.
- Pooled SKUs in one ad group at low AOV = 30–50% of spend on the wrong products. Top-converting SKUs underbid, slow products overbid, blended ROAS reads OK but per-SKU economics are upside down.
Nerdused hit break-even in month 1 because the foundation was right. Most operators spend that month paying the algorithm's tuition with no foundation to correct it.
Low AOV, policy-risk niche, or starting from zero? I can usually tell you in 30 minutes whether the same playbook fits.
Book a 30-min diagnostic →The methodology
Three months before scaling. Not patience, data.
Smart Bidding without conversion history is expensive noise. The right sequence: build data manually, layer in automation, then scale. Skipping to automation on day one means paying for the algorithm’s education at full-market CPAs with no foundation to correct it.
Currency convention on this page: Shopify revenue figures shown in USD ($), Shopify's native reporting currency. Google Ads cost figures shown in GBP (£), the account's denomination currency, with USD equivalents in parentheses converted at the Sep 2025 average rate ~1.34 USD/GBP. ROAS ratios are unaffected by currency choice (same ratio whichever side you compute it from).
- →Manual CPC only, full control, zero algorithmic guessing
- →Server-side conversion tracking set up and verified first
- →Feed cleaned: titles, prices, images, custom labels
- →SPAG structure built: one product per ad group
- →First real conversion data seeded into the account
Result: $3,300 in revenue. The real output was clean data.
- →Shopping campaigns expanded to 3 priority tiers
- →First Performance Max campaigns introduced
- →Smart Bidding layered onto Manual CPC conversion signal
- →Scripts begin managing per-product bid adjustments
- →ROAS target set at 110–120%, client break-even
Result: $34,000 in sales. The algorithm had enough to run on.
- →17 active campaigns: Shopping, PMax, Search, DSA, Demand Gen
- →PMax geo-segmented by market: UK, US, EUR, CAD, AUD
- →Asian city layer: Singapore, Hong Kong, Tokyo, Bangkok, Dubai
- →Manual CPC campaigns feeding data into Smart Bidding
- →Scripts running product-level bid management at full capacity
Result: $78,500 in December. Then $117K. Then $180K. Then $187K.
“120% target ROAS. That means every order had to be profitable on its own.”
Repeat customers exist in this niche and do come back, that’s real LTV. But we never built the economics around it. A 100% ROAS technically breaks even; returning buyers make the cohort look better over time. We targeted 120% because we wanted profit on every transaction, not just on the cohort average. Every order stands alone.
Before any campaign launched
This niche gets pixels banned. We built server-side tracking first. The account ran clean for 12 months.
Software key resellers are one of the highest-risk categories for ad account suspensions and pixel bans. Competitors in this space run into policy reviews, disapprovals, and tracking breakdowns regularly. We got the infrastructure right before touching campaigns, server-side tracking verified, clean account from day one, Google only.
Server-side tracking via Shopify
Conversion events sent server-to-server, not browser-to-pixel. Browser-based tracking in high-scrutiny categories gets flagged, blocked, or silently broken. Server-side means the data is clean, complete, and not subject to browser-level interference. Every conversion event was verified before the first campaign went live.
No black hat. No workarounds.
The account ran on standard Google Ads infrastructure throughout, no cloaking, no redirects, no policy-grey tactics. This niche has operators who use all of those. We didn't. Clean accounts scale. Accounts built on workarounds get suspended at the worst possible moment.
Google only. By design.
We ran Google exclusively. This niche carries real risk on platforms with stricter automated policy enforcement. Rather than split resources across channels with uncertain approval timelines, we went all-in on Google where the channel was open, the tracking was solid, and we could move from day one.
Wow moment #1, Campaign structure
One product. One ad group. Every SKU gets its own bid logic, its own budget, its own data.
SPAG, Single Product Ad Group, means Office 365 Pro Plus never shares a bid with Office Standard 2024. They convert at different rates, at different price points, from different search intents. When they share an ad group, the algorithm compromises to the average. Split them out, and each product is priced to its actual economics.
Why SPAG at $20 AOV is non-obvious
Most SPAGs are built for high-AOV products where margin variance justifies the complexity. At $20 with 50+ SKUs, the temptation is to group everything and let Smart Bidding sort it out. The problem: Office 365 Lifetime converts at 3× the rate of Office Standard. In a shared group, one bid covers both, you overpay for Standard and underbid for Lifetime. SPAG fixes this at the source.
Per-product keyword sets
'Buy Office 365 Pro Plus lifetime' lives in the 365 Lifetime group only, not mixed with 50 other SKUs. Quality scores improve because keyword matches ad matches landing page. Search terms are readable per product. Irrelevant traffic is excluded before it enters the auction.
Bestseller cloning
Top-converting products got cloned into dedicated high-priority campaigns with tighter bid control and uncapped daily budgets. Office 365 Pro Plus, responsible for 40% of revenue, ran in its own campaign. It didn't compete for daily budget with low-volume SKUs.
Custom labels for performance tiers
Custom labels flagged every product in the feed by conversion rate tier, margin tier, and inventory status. High-performers landed in high-priority campaigns. Tail products sat in low-priority. The structure adapted to the economics, not the other way round.
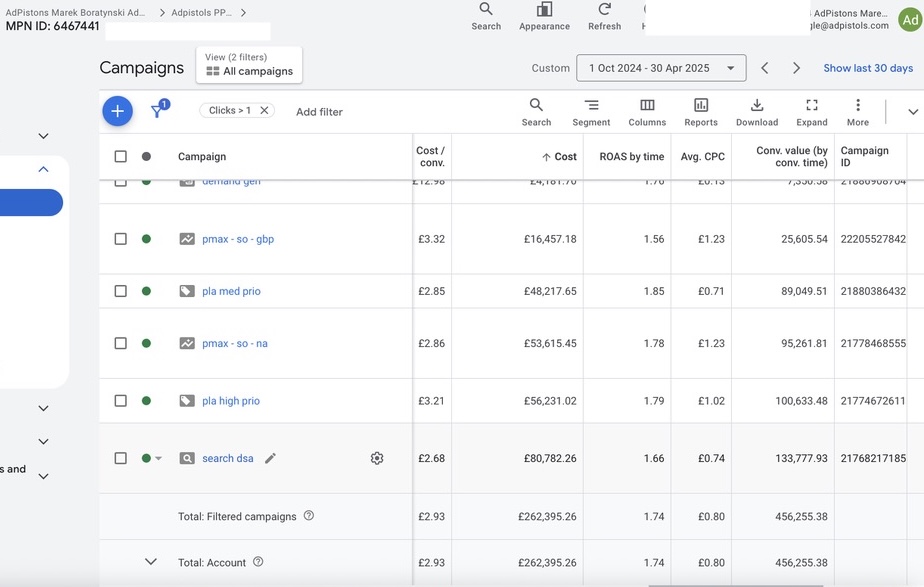
Fig 1, Shopping campaigns by priority tier · Oct 2024 – Sep 2025 · pla high prio + pla med prio
Wow moment #2, Automated bid management
Scripts pulling per-product data and adjusting bids without human input. At 155 orders/day, manual management isn’t slower, it’s wrong.
At peak, the account processed 155+ orders per day across 50+ SKUs in 5 markets. Manual bid changes at that volume aren’t just slow, they’re inaccurate by the time you make them. Scripts ran continuously: pulling product-level performance data, weighting by actual SKU margin, pushing bid adjustments back into each campaign without waiting for a human to notice.
Impression-based bid signals
Scripts tracked impression data in 30, 60, and 90-day rolling windows per product. A product losing impressions against its 90-day baseline had fallen behind the auction, the script raised its bid. A product winning impressions but missing ROAS target got trimmed. No delay between signal and action.
Per-SKU ROI weighting
Every product has a different margin. Office 365 Lifetime has different economics than Office Standard 2024. Scripts weighted bid adjustments by actual ROI per SKU, not blended account ROAS. A 10% bid increase on a $40 product at 80% margin is a completely different decision than the same move on a $15 product at 50%.
Automated search term hygiene
50+ ad groups generate query waste fast. Month one required daily manual exclusion. By month two, a script ran weekly exclusion logic: no-conversion and high-cost search terms removed at scale across all groups simultaneously. Branded competitor terms, irrelevant categories, low-intent modifiers, excluded automatically.
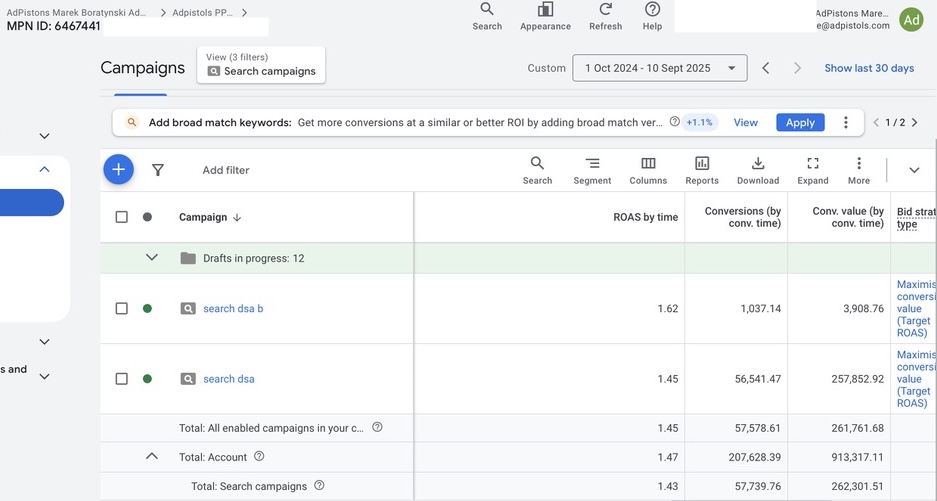
Fig 2, Search campaigns · DSA + DSA B · Oct 2024 – Sep 2025 · long-tail catch layer
DSA campaigns covered the long tail, queries too specific for Shopping to catch reliably. Dynamic Search Ads matched against product page content, capturing intent Shopping missed. Search DSA: £178K spend, 1.45× ROAS, £257K conversion value (≈$239K → $344K USD). DSA B: 1.62×. Scripts kept exclusion lists synced across both to prevent overlap with Shopping campaigns.
Wow moment #3, Geographic and currency architecture
8 currencies in the feed. One PMax campaign per country. Asian cities targeted individually, not as a continent.
Digital software keys sell globally. Targeting “worldwide” in one campaign sounds efficient, it means the algorithm mixes markets with different CPCs, different conversion rates, and different margin profiles. When UK ROAS drops in a competitive week, it shouldn’t drag the NA campaign’s numbers with it. Each market gets its own budget, its own bid target, its own learning history.
Performance Max, 5 geo-segmented campaigns
- pmax-so-na, North America1.51×£124K (≈$166K)
- pmax-so-gbp, United Kingdom1.37×£59K (≈$79K)
- pmax-so-eur, Eurozone1.20×£28K (≈$38K)
- pmax-so-cad, Canada1.15×£7K (≈$9K)
- pmax-so-aud, Australia1.07×£3K (≈$4K)
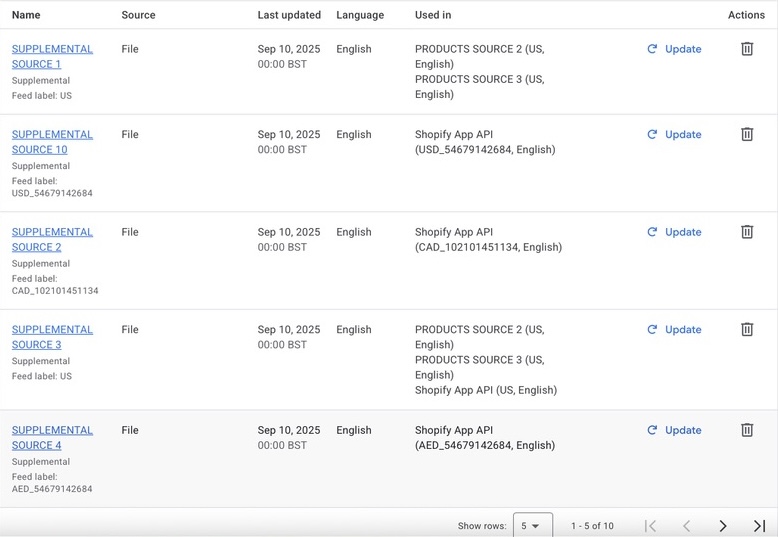
8-currency feed, 10 supplemental sources
The product feed split into 8 currency variants, each market sees prices in local currency. This prevents two failure modes: (1) Merchant Center price mismatch errors when the store shows local currency but the feed shows GBP, and (2) checkout drop-off when buyers hit a foreign currency at payment.
10 supplemental feeds in Merchant Center, each mapped to the correct Shopify API endpoint and updating on the same schedule as the primary feed. GBP, USD, EUR, CAD, AUD, AED, plus two additional markets.
Fig 3, PMax campaigns by geography · Oct 2024 – Sep 2025 · ROAS and conv value per market
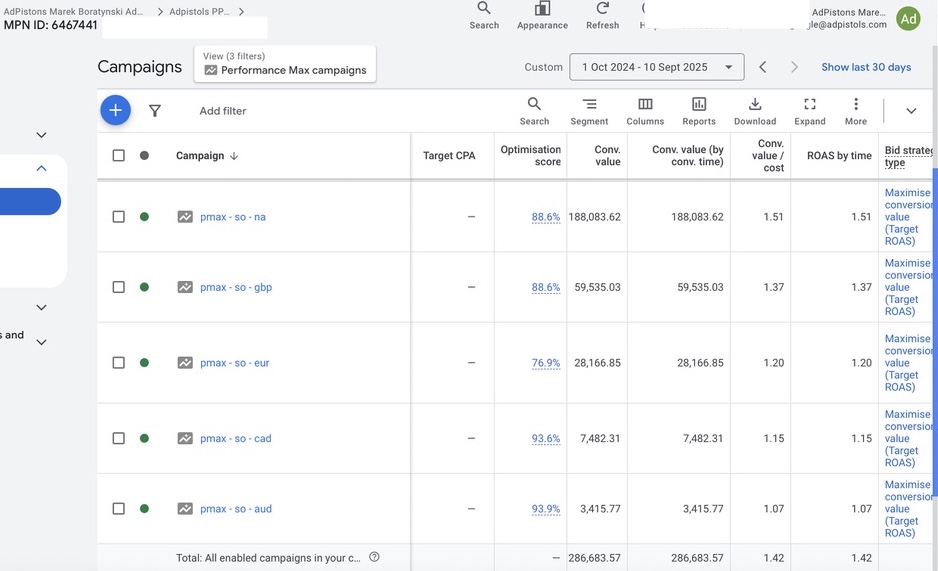
Fig 4, Google Merchant Center · Supplemental feeds · 10 currency-segmented sources
What the client said
“Within the first month, I achieved a break-even point. In the second month, we not only generated profits but also expanded our operations, aiming for significant growth.”
Nerdused · Upwork-verified 5★ review · $35,200 contract · Oct 2024 – Sep 2025
Want this server-side + SPAG + scripts architecture in your stack? 30 minutes, your account, honest read on fit.
Book the call →Wow moment #4, The brand that paid ads built
Direct traffic was near-zero in October. 24,761 direct sessions by August. Google Ads built the brand.
By August 2025, paid Google Search was delivering 111,206 sessions in a single month. Direct sessions that same month: 24,761. That direct traffic is brand recognition built through paid exposure, people who found Nerdused through a Shopping ad, bought, remembered the name, and came back direct. Last-click paid attribution undercounts the full impact. The real contribution of the Google campaigns is larger.
Fig 5, Shopify attribution by channel · Oct 2024 – Sep 2025 · paid vs direct growth over time
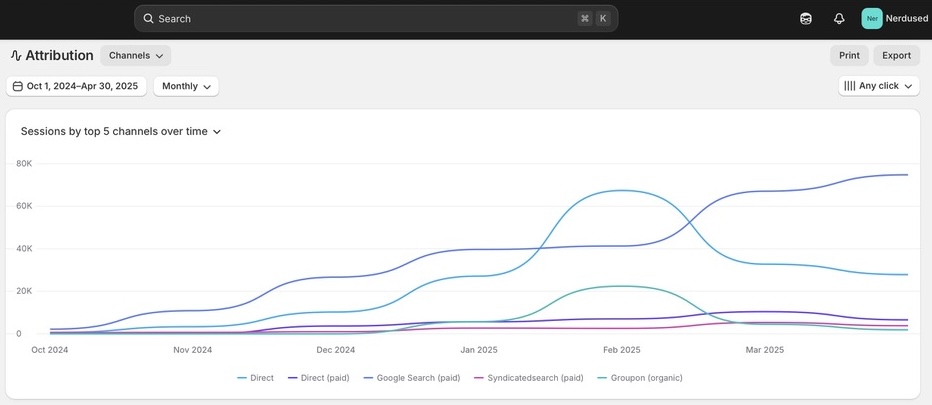
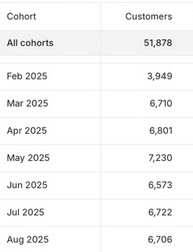
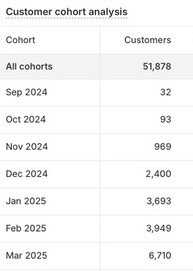
Fig 6, Customer cohort · new customer acquisition by month · Oct 2024 – Sep 2025
51,878 new customers acquired. ROAS 100%+ covers the client’s costs on every order, the business is profitable from the first transaction. We targeted 120% to maintain a margin buffer above break-even, not just survival. The charts show the acquisition machine: consistent new customer intake, month after month, at a profitable CPA.
What the $1.5M was actually built on
Tracking verified before spend went live
Server-side conversion tracking was set up and confirmed before the first campaign launched. In a niche where browser pixels get flagged and accounts face higher policy scrutiny, bad tracking means optimising on corrupted data from day one. We fixed the foundation before touching campaign settings.
Feed quality is 80% of Shopping performance
Clean titles, accurate prices, local currency per market, custom labels mapping product economics to campaign priority. A mediocre bid strategy on a clean feed beats a great strategy on a broken one. Every feed error is a product invisible in Shopping regardless of bid.
Manual CPC seeds Smart Bidding, don't skip it
Running Manual CPC for month one wasn't primitive, it was deliberate data seeding. Every conversion logged in Manual CPC is signal Smart Bidding inherits when you transition. Cold-started Smart Bidding guesses. Launched with three weeks of real conversion history, it starts from somewhere real. The month-two jump was a direct consequence.
Structure earns the right to scale, it doesn't assume it
21 campaigns weren't built in week one. Each layer was added after the previous proved itself: Shopping before PMax, Manual CPC before Smart Bidding, UK before international. Structure grew in response to performance data. Premature complexity breaks accounts. Earned complexity scales them.
Operator's note
The Nerdused engagement ran from October 2024 through September 2025. By August 2025, monthly revenue had stabilised at $200K+. The operator chose to sell the store rather than scale the customer support function past his single-operator capacity. The infrastructure I built ran clean for 12 consecutive months, every number on this page is from that window.
I've been running Google Ads, GMC, and server-side tracking for e-commerce since 2010. Fourteen years, 150+ accounts, €50M+ in managed spend. I know which policy-risk niches need which tracking architecture, how to seed Smart Bidding without burning budget, where the default Shopping setup leaves money on the table at low AOV, and how to scale across 5+ markets without one bad market dragging the account average down.
Tell me what your stack looks like, what your AOV is, what your policy exposure is, and what you're trying to scale. I'll tell you whether the same framework applies, what it would cost to build, and what it would cost to keep running. No pitch.
What working with me looks like
From your first call to an account that compounds month over month.
No deck, no procurement, no 6-month "discovery." This is what an engagement actually looks like, end to end.
Build
Server-side tracking deployed and verified. Feed cleaned (titles, prices, custom labels). SPAG structure built, one product per ad group. Manual CPC only, no algorithmic guessing. Output of month 1 is clean conversion data, not revenue.
Stabilise
Shopping campaigns expanded to priority tiers. First PMax campaigns introduced. Smart Bidding layered onto Manual CPC signal. Scripts begin managing per-product bid adjustments. ROAS target locked at break-even +20%.
Scale
17+ campaigns active (Shopping, PMax, Search, DSA, Demand Gen). PMax geo-segmented per market. Manual CPC continues feeding data into ML. Scripts at full capacity. Account compounds month over month.
Compound or hand off
Weekly bid reallocation, audience refresh, feed maintenance. Either continue as managed engagement or full handoff documentation (architecture diagram, runbook, monitoring playbook). Your call.
Common questions before you book
The six things every DTC operator asks me first.
How long until I see results?
2-3 months for tracking foundation + early channel signal. Nerdused hit break-even in month 1 (clean tracking + manual CPC), profit in month 2, scale in month 3. The compounding payoff comes in months 6-12 once Smart Bidding has enough conversion history to optimise sharply.
What if I'm in a policy-risk niche (software keys, supplements, regulated)?
Same playbook as Nerdused. Server-side tracking from day one, no browser pixel exposure, no policy-grey tactics. Clean accounts scale; workarounds get suspended. Nerdused ran 12 straight months in a high-scrutiny niche without an account incident.
What does the build cost?
Depends on scope, never less than €6,000. Tracking + Google Ads + feed + reporting layer typically scopes between €8K–€15K one-time for the build. Ongoing management is separate, Full Stack retainer from €5,000/month per channel (Google + Meta together from €9,000/mo) or single-channel Growth start from €3,500/mo that auto-upgrades past €30K/mo profit. Scoped after the diagnostic, fixed price before any work starts.
What if my AOV is low ($10-$30)?
Low AOV is what this playbook is built for. The math at $20 AOV is unforgiving, every standard benchmark is wrong. Nerdused targeted 120% ROAS (break-even +20%), drove volume, and exited at $1.5M in 12 months. Same logic applies to supplements, software, low-ticket DTC.
Do you work alongside an existing agency or replace them?
Both options work. I can co-pilot with your team (tracking + feed + structure layer while they keep account management), or take over end-to-end. Tell me what model fits your operation. No exclusivity demand.
What happens if we stop working together?
Full handoff documentation: architecture diagram, scripts source, GTM container, feed mapping, runbook. Your in-house team or any future operator can pick up the work. Nerdused was sold mid-engagement; the new owner continued with the existing infrastructure unchanged.
Transparency
What this case study doesn’t show, and why.
Meta / Facebook
We ran Google only. Zero Meta spend, this was a Google engagement. If Facebook or Instagram performance is part of your evaluation criteria, this case study doesn't cover it.
Month-by-month ad spend detail
Campaign screenshots show aggregate spend by campaign type. Monthly spend totals are not published here at the client's request. What's visible is enough to verify the structure and ROAS figures, the spend breakdown is confidential.
Product margin data
The 120% ROAS target was calibrated against actual product margins shared privately. Those margins aren't published here. What you can verify: the targets held, the account scaled, and 56,758 orders were fulfilled profitably at that threshold.
The full 12-month numbers
Fig 7, Shopify analytics · Sep 2024 – Aug 2025 · gross sales, orders, AOV, top products
$1,500,198 gross. $1,404,759 net after $94,687 in returns and $751 in discounts. 56,758 orders, 56,000 fulfilled. $26.42 average order value. Top products: Microsoft Office 365 PRO PLUS Lifetime ($334K), Office Professional Plus 2024 ($317K), Office Standard 2024 ($79K). September 2024 baseline: $1,009.
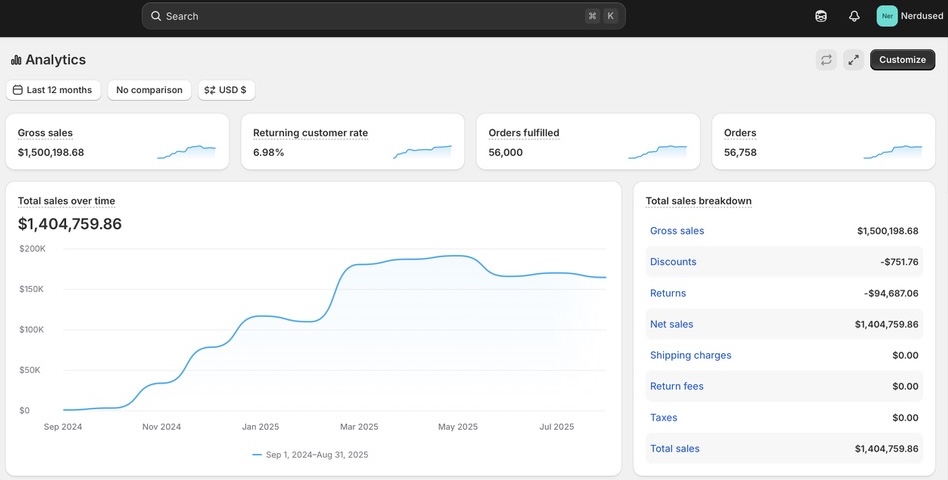
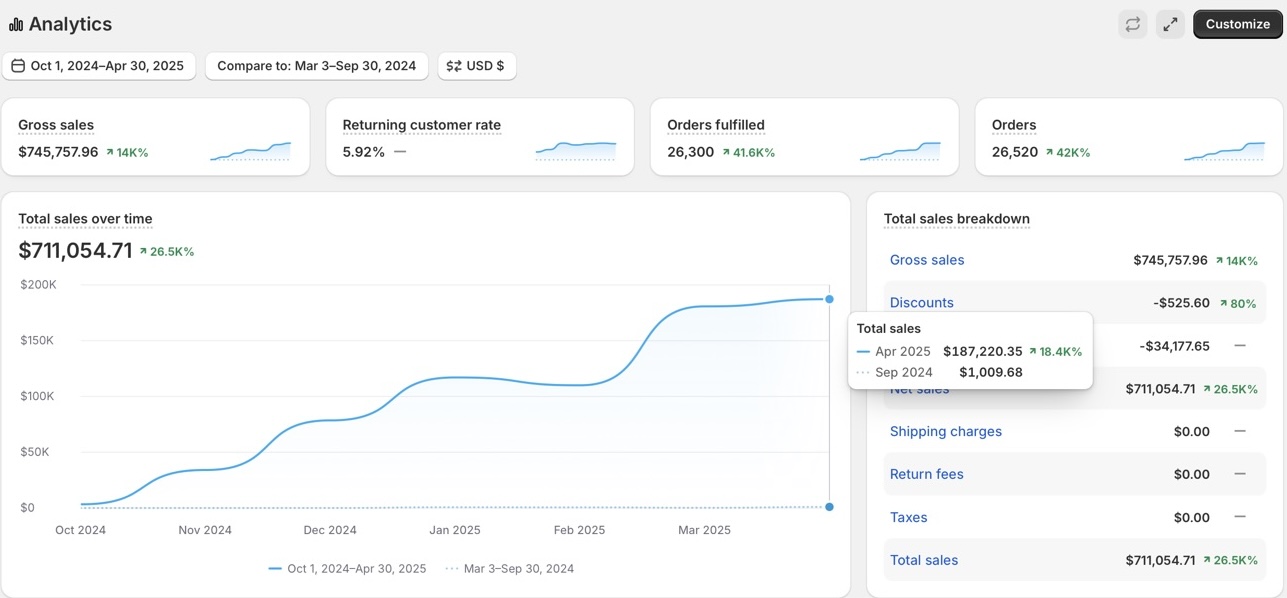
Fig 8, Shopify analytics · Oct 2024 – Apr 2025 · the growth ramp month by month
552,698 sessions. $711,054 in sales. 26,520 orders. 4.80% conversion rate. The chart shows the non-linear ramp: flat in October, accelerating through December, then compounding monthly through April. That acceleration is Smart Bidding stacking on accumulated conversion data, each month’s conversions make next month’s bidding sharper.
"Marek possesses exceptional expertise in his field. As a specialist in data analysis, he collaborates closely with Google. I began my journey with no resources, yet within the first month, I achieved a break-even point. In the second month, we not only generated profits but also expanded our operations, aiming for significant growth. There is no need to seek alternatives; simply exercise patience and place your trust in Marek. You will be pleased to have discovered his talents."

Nerdused · ecommerce · Upwork verified
Selective by design · 1-2 e-commerce engagements per quarter
Low AOV, policy-risk, or starting from zero conversion history? All three start with a 30-minute call.
Shopify or DTC, paid spend €10K+/month, 3-month minimum engagement. Your account. Your numbers. An honest read on what's broken and whether this is the right fit, no pitch, no deck.
Path 1 · Free
Tracking Diagnostic
6 questions. 90 seconds. Find out if broken tracking is costing you revenue, includes a 30-minute call to walk through the findings together.
Run the Diagnostic →Path 2 · Paid · €1,500 fixed
Full Audit
Up to 3 marketing channels in one written report: structure, tracking, attribution, plus an AI opportunity layer. Delivered within 72 hours. No upsell.
See audit options →Path 3 · Direct
Strategy Call
Skip the steps. 30 minutes, your situation, my read, honest answer on fit and what it costs.
Book the Call →Or email contact@adpistols.com with your situation.