Fashion marketplace · Google Ads · Germany · 4.5 months
Previous specialist broke tracking, performance, AND GMC. I rebuilt all three in 60 days.
Migration from Shopify killed their sales. I rebuilt everything. €3.2M later, the client wanted to rename me AdSniper.
German sneaker marketplace. Previous specialist migrated off Shopify and shredded three things at once: conversion tracking, Shopping performance, GMC catalogue. The first job wasn't optimisation, it was triage.
60 days to rebuild the foundation, server-side tracking from scratch, SPAG campaign architecture, GMC fixed. Four months of compounding scale after that. CPA €30.32 → €9.80. €217K spend → €3.2M GA-confirmed revenue.
€10K+/mo Shopping accounts only. 1-2 engagements per quarter.
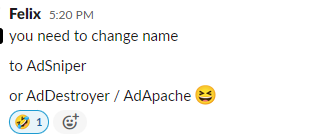
"You need to change your name to AdSniper. Or AdDestroyer. AdApache."
Felix, founder · Sneakit · Unsolicited Slack message at week 14. That message is why the H1 says what it says.
What this case study actually proves
- One marketplace, one engagement, 60-day rebuild + 4 months of compounding scale. Not portfolio averaging.
- Previous specialist's migration broke tracking, ad performance, AND Google Merchant Center products. I rebuilt all three layers from scratch.
- Real GA4 + Google Ads screenshots, verifiable math, account name visible in every screenshot.
Who this case study is for
- Shopify or post-Shopify e-commerce operators with large catalogues (50+ SKUs) and Shopping-heavy spend
- Marketplace / fashion / outlet brands optimising on CPA not just ROAS (volume + thin margin model)
- Brands burned by a previous agency or specialist whose migration / 'optimisation' broke the foundation
- DTC operators at €10K+/month Google Ads spend scaling Shopping into Q4 seasonality
E-commerce since
14+ yrs
Google Ads, GMC, server-side tracking, Shopify and beyond
E-com accounts managed
150+
Shopify, custom storefronts, headless, classic platforms
E-com spend processed
€50M+
Across DTC, marketplaces, fashion, outlet, lifestyle
This case scale
€3.2M
GA-confirmed revenue in 4.5 months on €217K spend (14.7× ROAS)
Every number below is documented with screenshots from the actual accounts.
The starting situation
Broken signal. Diagnosed in 30 days. Rebuilt in another 30.
The first job wasn't optimisation. This is what happens when a Shopify migration goes wrong and nobody fixes the tracking. Conversion signals break. Smart bidding starves. You're spending real money on decisions made from phantom data. Before a single bid was touched, the question had to be: what's actually working, and what has to be rebuilt?
Diagnosis
- Full audit: GA4, GTM, Shopify pixel, data layer, all of it
- Shopify migration confirmed as the root cause of conversion gaps
- Attribution discrepancies mapped between Google Ads and GA4
- Verdict: half needed patching, half needed replacing from scratch
Rebuild
- Server-side tracking stack deployed from scratch, no plugin, no shortcut
- SPAG campaign structure rebuilt across the full product catalogue
- Feed restructured: titles, price signals, availability rewritten
- CHEQ bot filtering live, invalid traffic blocked before it touches spend
Scale
- Clean conversion data in, Smart Bidding stabilises immediately
- Pre-rebuild baseline (May–Aug, broken signal): €30.32 CPA, 10.95× ROAS
- Into Q4: weekly budget reallocation, seasonal uplift, RLSA layers
- Sep–Dec: €9.80 CPA · 13.05× ROAS Google Ads · 14.7× ROAS GA4 · €3.2M revenue
The uncomfortable truth: Most operators would have run the broken setup and called the small improvements "progress." The two months it took to rebuild the foundation bought four months of compounding, clean data, which is the only reason the €9.80 CPA is real. You cannot optimise what you cannot measure.
What broken tracking actually costs you per year
Run the math on a typical post-migration e-commerce account with broken conversion tracking:
- €200K/year ad spend, 60% conversion attribution loss = ~€120K of bidding decisions made from phantom data.
- At typical 40% margin on the routed-wrong spend = €48K/year of pure waste, plus opportunity cost on the SKUs that should have been getting the budget instead.
- CPA inflates 2-3× because Smart Bidding starves on dirty signal. Sneakit's pre-rebuild CPA was €30.32. Post-rebuild on clean signal: €9.80. Same business, same SKUs, same buyers.
- Add GMC product disapprovals (Sneakit had hundreds post-migration) and the account is bleeding from three holes at once: tracking, bidding, AND product visibility.
Most operators don't run this math because the cost shows up as "we couldn't scale," not as a line item.
Sound familiar? I can usually tell you in 30 minutes whether your tracking + feed foundation is the bottleneck.
Book a 30-min diagnostic →What you should stop doing immediately
Five default setups that guarantee your e-commerce account underperforms.
If you recognise any of these in your current operation, you already know why the channel isn't scaling. None of them are fixable with "better creative" or "smarter bidding."
Letting a specialist migrate your store off Shopify without a parallel-run tracking validation. You'll find out the foundation is broken after the campaigns lose 60% of conversion data.
Running pooled Shopping campaigns where your best-margin SKUs subsidise the dogs. You can't see the cross-subsidisation happening because the bidding is platform-level, not product-level.
Trusting a CAPI plugin (€100-€400/month) instead of a real server-side stack. Plugins add CAPI events but rarely enrich PII at the depth Meta and Google reward.
Setting your Shopping feed once and forgetting it. Every product needs 3-4 title variants tested head-to-head. The auction tells you which language converts.
Letting bot traffic corrupt your audience lists and conversion data. At scale, 5-10% of paid traffic is non-human. Without filtering, that's retargeting budget set on fire.
The campaign machine
30 orders a day in August. 447 in a single December day. Every euro routed to the product that earns it.
Most Shopping setups pool products together and let Google decide where to spend. Your best-margin SKUs end up subsidising the dogs, and you can't see it happening. SPAG fixes that: one ad group per product, full bid control at SKU level, negatives propagated across every priority tier so nothing leaks. Weekly reallocation means winners get more fuel every cycle. Four months of that compounding into Q4 is what 447 orders in a single day looks like.
SPAG, Single Ad Group per Product
Result: every SKU bids on its own margin. No cross-subsidisation.
Every product gets its own ad group. Not one campaign per product, that's unmanageable at this scale. One ad group per product, with campaigns tiered by priority. Top performers bid aggressively. Discovery tier stays defensive. Nothing bleeds across contexts.
- High-priority tier: proven SKUs with aggressive bids, no subsidising low-performers
- Mid-priority tier: brand + model terms capture assisted revenue
- Low-priority tier: catalogue coverage, new arrivals, discovery
- Negative lists across all tiers, zero inter-tier cannibalisation
Multi-feed optimisation, 3–4 variants per SKU
Result: spend only on titles the auction confirms convert.
Most operators set the feed once and forget it. Here, every product runs 3–4 title variants head-to-head. The Shopping auction reveals what language actually converts. Prices formatted for German market expectations. Availability synced real-time, no impressions burned on out-of-stock SKUs.
- Title variants: brand+model vs model+category vs category+size, winner runs
- Custom labels tier every product by ROAS, budget flows to profit, not just volume
- Real-time stock sync, OOS products pull spend automatically
- Margin-negative SKUs excluded at feed level before they waste a single bid
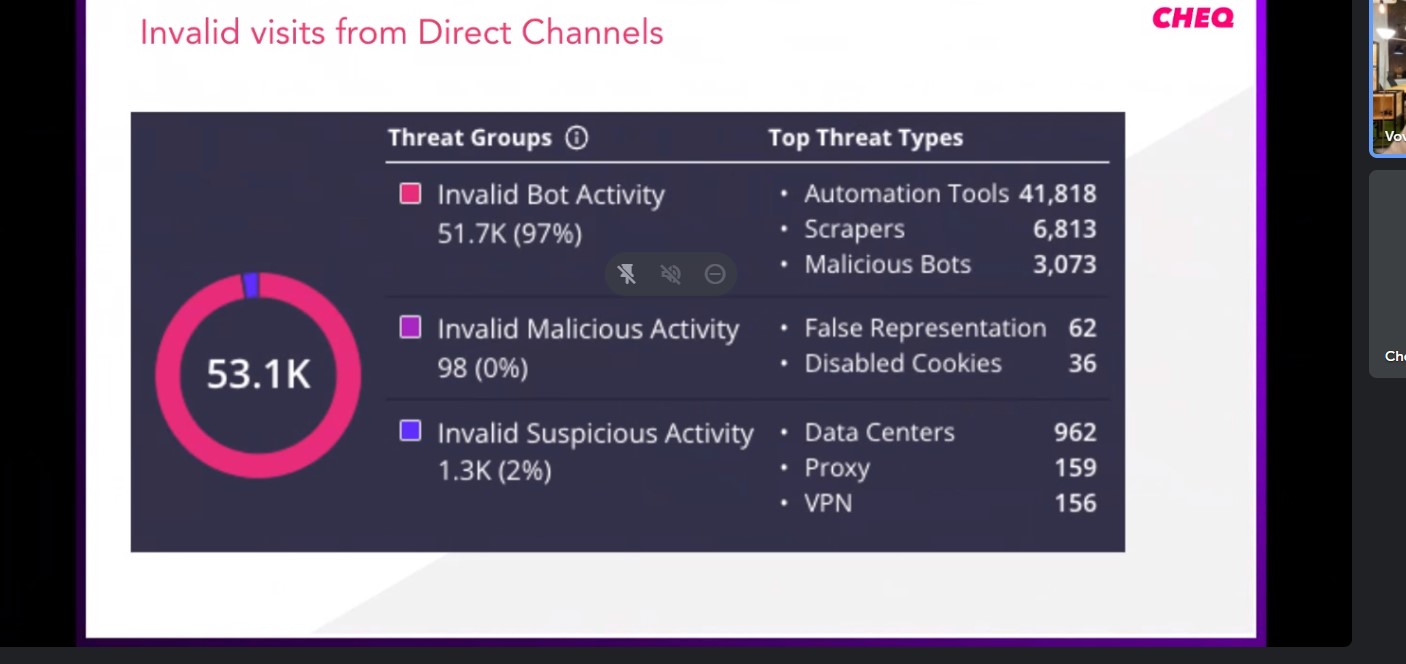
CHEQ bot filtering, 53K invalid visits blocked
Result: clean audience lists, trustworthy conversion data.
At this traffic volume, bots are a real budget problem, not a theoretical one. 53,143 invalid visits identified and blocked. 97% classified as bot activity. Without filtering, those visits corrupt your audience lists, inflate your direct channel conversion data, and get retargeted like real customers.
Every channel validated. No assumptions.
Result: spend goes where the data says it converts.
Shopping drives the volume. Search plays support for brand and category intent. But which audiences actually convert, and where? That gets tested, not assumed.
- B2C, Facebook: direct-to-consumer buying intent, primary revenue driver
- B2B, Twitter + Facebook: wholesale and retailer segment, both channels tested
- RLSA on top-tier Shopping: returning visitors and cart abandoners get bid uplift
- Automated scripts: day-of-week + stock-level bid adjustments, no manual babysitting
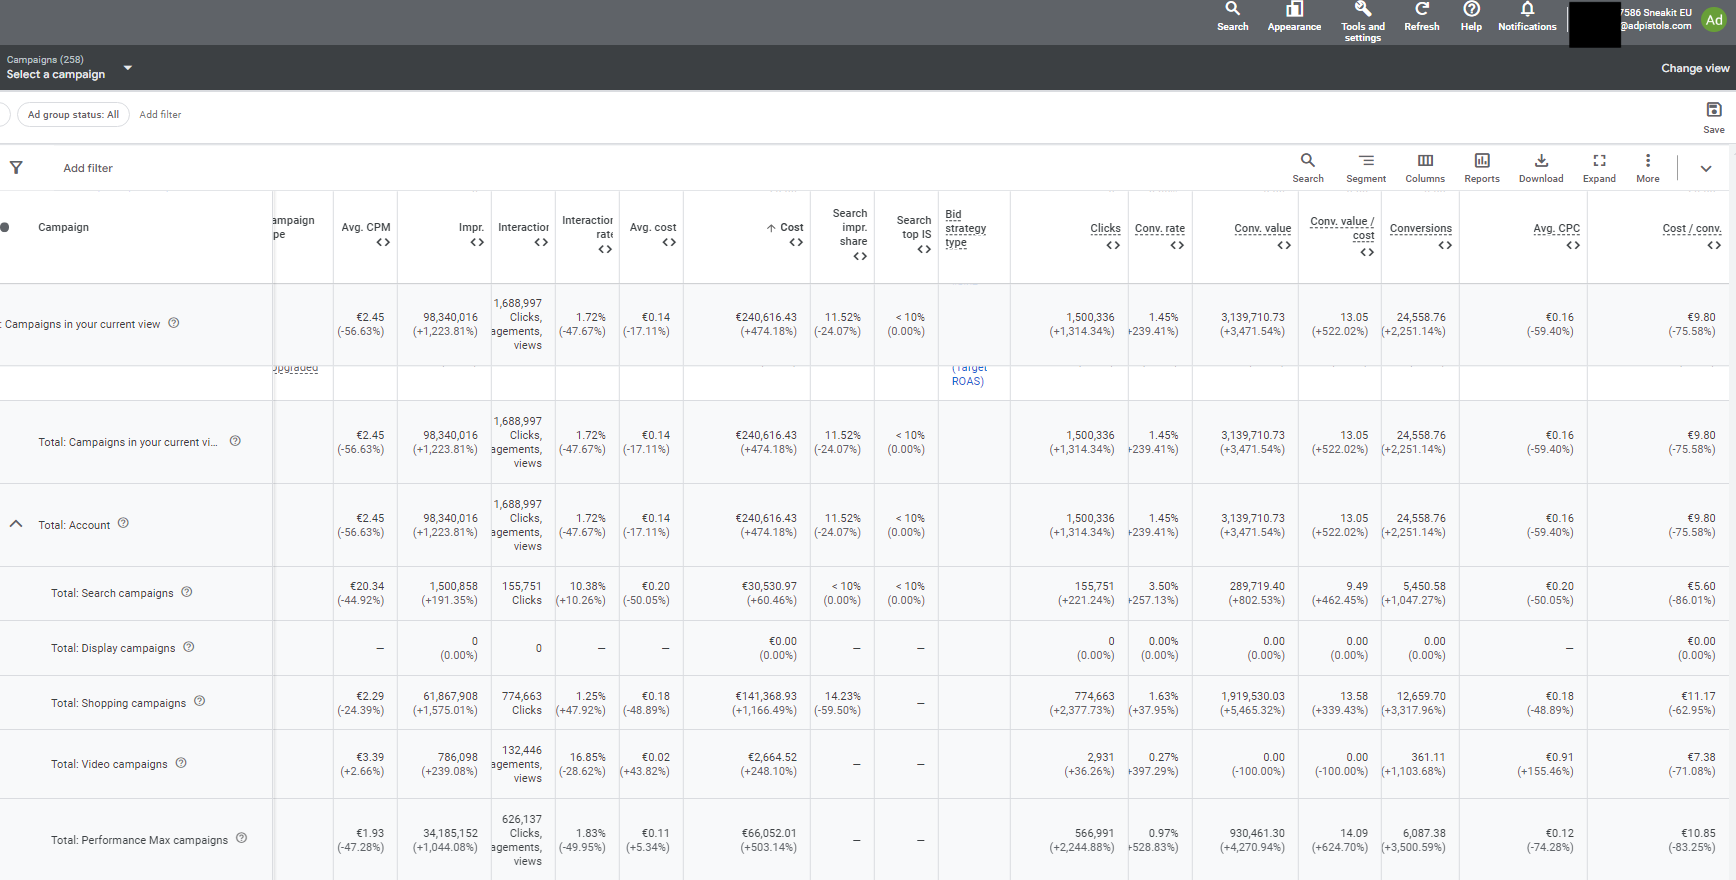
Campaign mix, Sneakit EU account
Shopping carries the conversion volume. Search as the intent capture layer. Display for retargeting only.
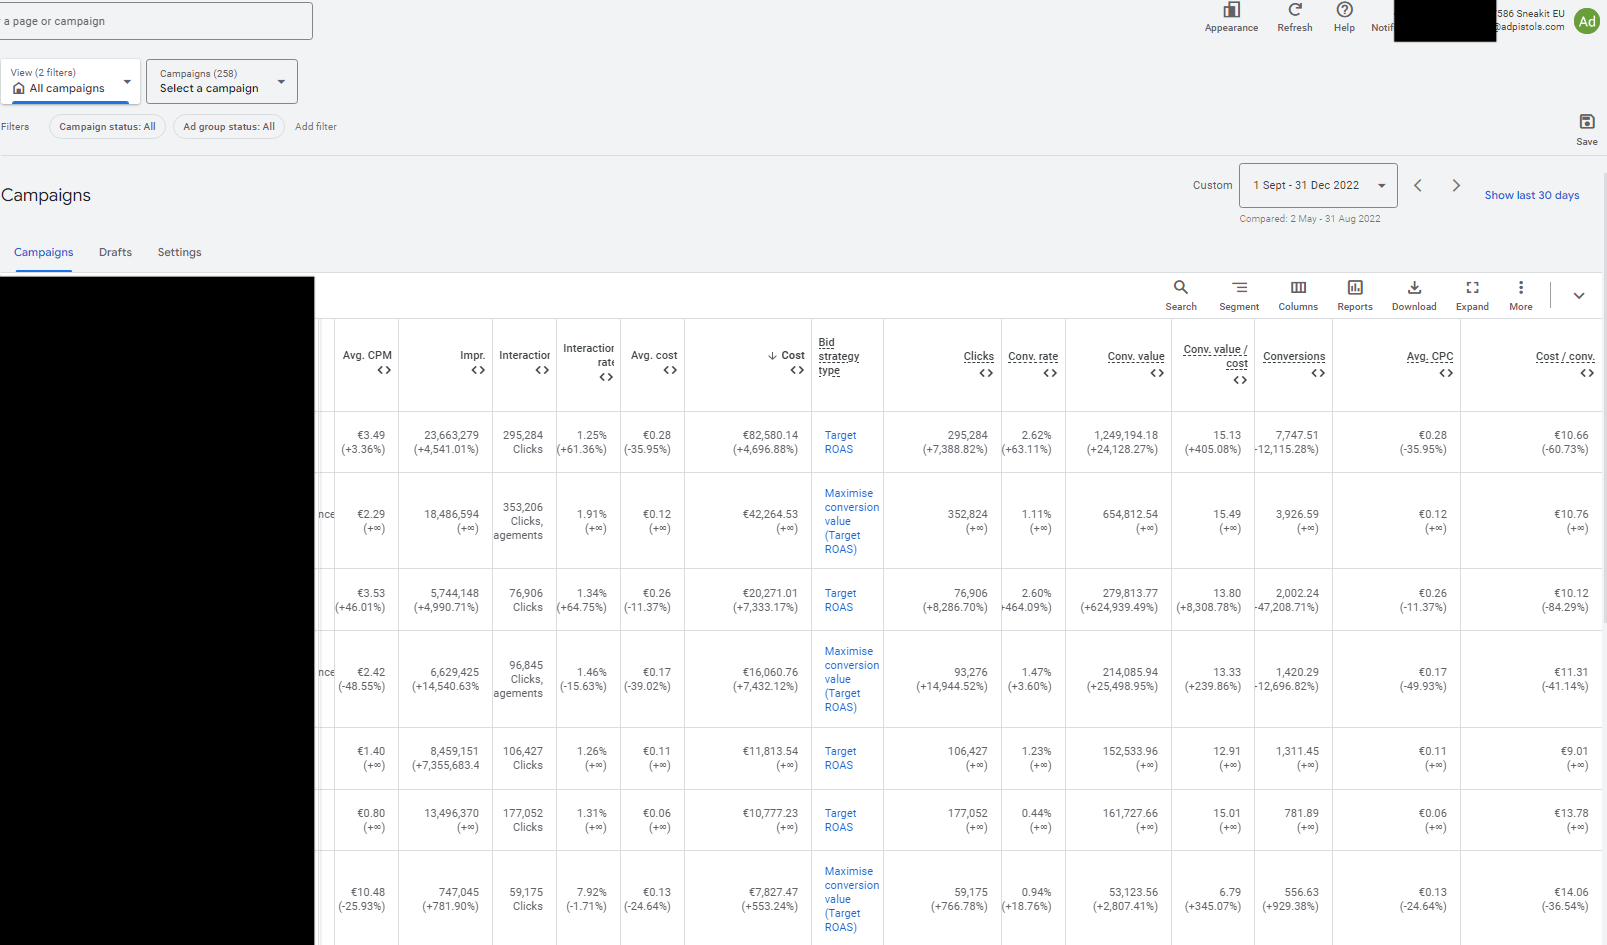
Campaign-level view, SPAG in practice
Each row is a separate bidding context. No product grouped with another. No bleed.
The infrastructure
The Toyota Land Cruiser of attribution.
A Land Cruiser isn't beautiful. It's engineered. It takes you exactly where you need to go, through iOS updates, through ad blockers, through browser restrictions, every time. This is a custom server-side stack built from scratch. Not a CAPI plugin. Not a $1,500/mo third-party tool. Four tiers. Every event enriched with PII-encoded first-party data. 9.2 event match quality.
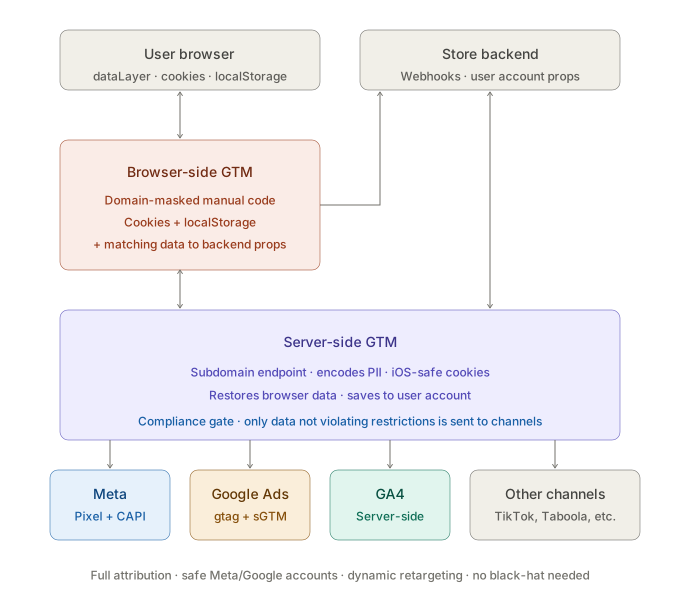
Why this setup fires when everything else goes dark
Tested against the best alternatives. Won.
I ran this setup head-to-head against Elevar and Littledata, the two tools most commonly recommended for Shopify tracking, each €100–€400/month. On a comparable account: 20% more Facebook-attributed revenue. The difference isn't the platform. It's the depth of PII signal enrichment.
Event Match Quality
9.2 / 10
vs Elevar + Littledata (and Hyros on different client)
+20%
Cookie lifetime
Extended
Ad blocker resilience
Full
When iOS 14 wiped everyone's attribution, here's what happened to Framar
Framar, Canadian/US professional haircare, $4.03M year 1, runs the evolved version of this same stack. When iOS 14 hit and wiped attribution for most advertisers, Framar held 95% accuracy and scaled 200–300% month-over-month. Competitors were flying blind. Framar was accelerating.
Proof, in screenshots
€3.2M verified. GA4 tracking Shopify transactions directly. Pull the numbers yourself.
GA4 tracks actual Shopify transactions, not what Google Ads claims it drove. That's why the number is credible. Below: the period comparison that shows the CPA collapse, the transaction trend that shows what compounding looks like, and the peak week that shows where four months of clean data meets Q4.
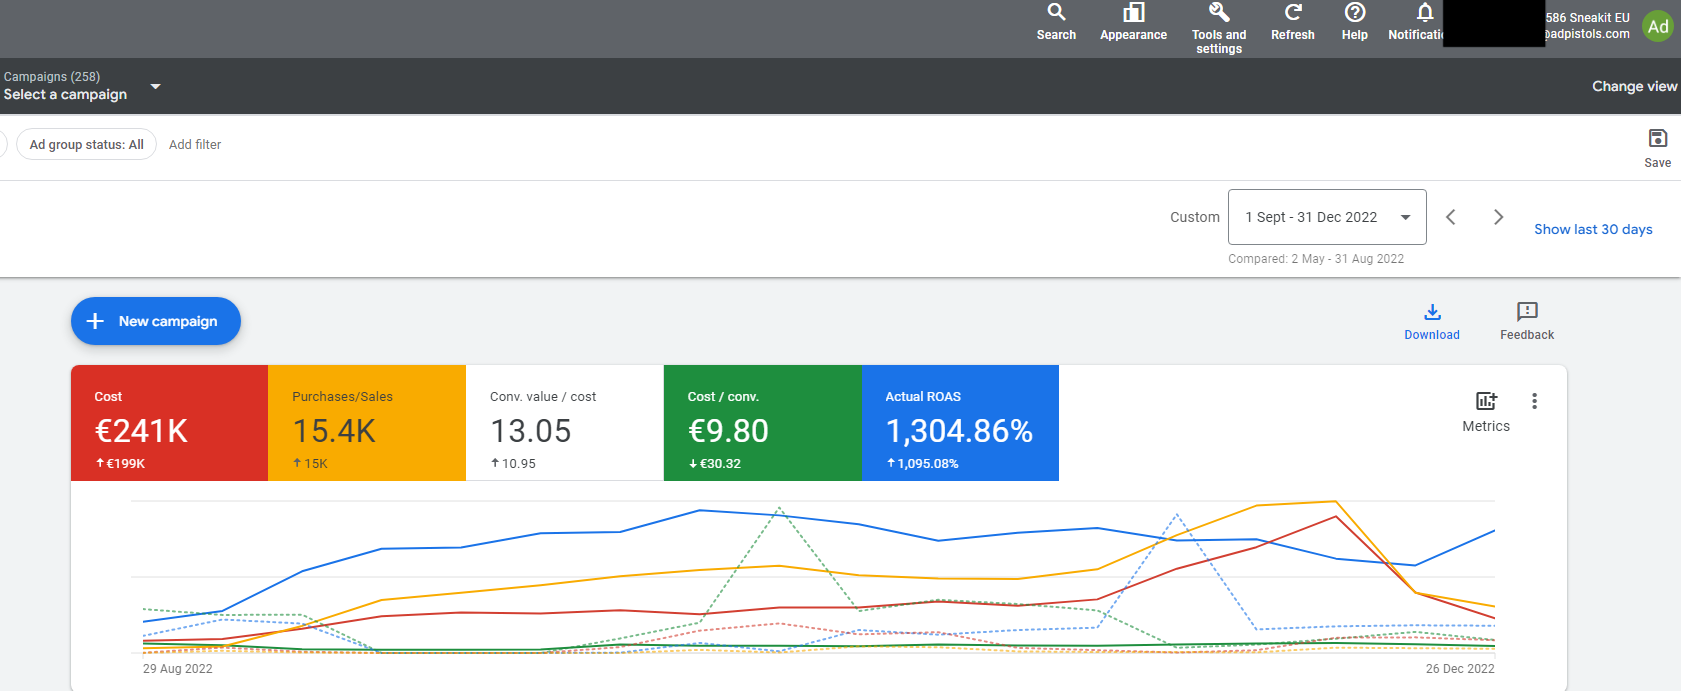
Fig 1 - Sep–Dec vs May–Aug · CPA −68%, ROAS +19%, same account, more spend
Side-by-side period comparison. Sep–Dec 2022: €241K spend, 13.05× ROAS, CPA €9.80 (Google Ads attribution, Purchase conversion action only). May–Aug 2022 baseline: €199K spend, 10.95× ROAS, CPA €30.32. Same metric, same definition in both periods. About the 15.4K purchases figure visible in the screenshot alongside: that's GA4-attributed purchases for the same window. GA4 uses a stricter attribution model than Google Ads' own click + view window, which is why GA4 attributes fewer purchases to the channel than Google Ads attributes to itself. Two attribution lenses on the same engagement, both real, both pulled directly from the platforms. Google Ads was the only significant paid channel here, so any GA4 underreporting maps cleanly to the Google Ads side. Account: 'Sneakit EU', AdPistols Mark Boratynski as manager.
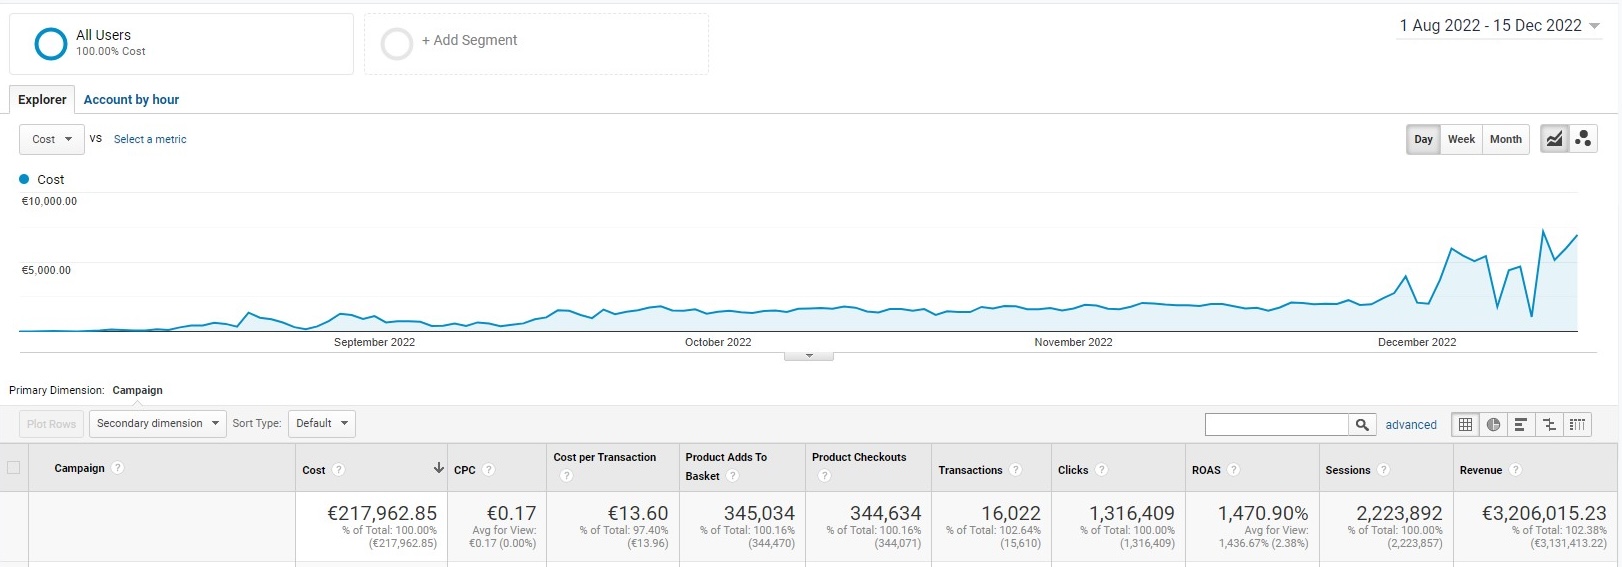
Fig 2 - €3,206,015 revenue, GA4 backend truth, not Google Ads attribution
GA4 Optimization Report. Revenue: €3,206,015.23. Spend: €217,962.85. ROAS: 1,470.90% (14.7×). Transactions: 16,022. Sessions: 2,223,892. CPC: €0.17. Cost per transaction: €13.60. GA4 pulls transactions straight from the Shopify backend, so the €3.2M is what actually hit the books, not a platform's claim about its own clicks.
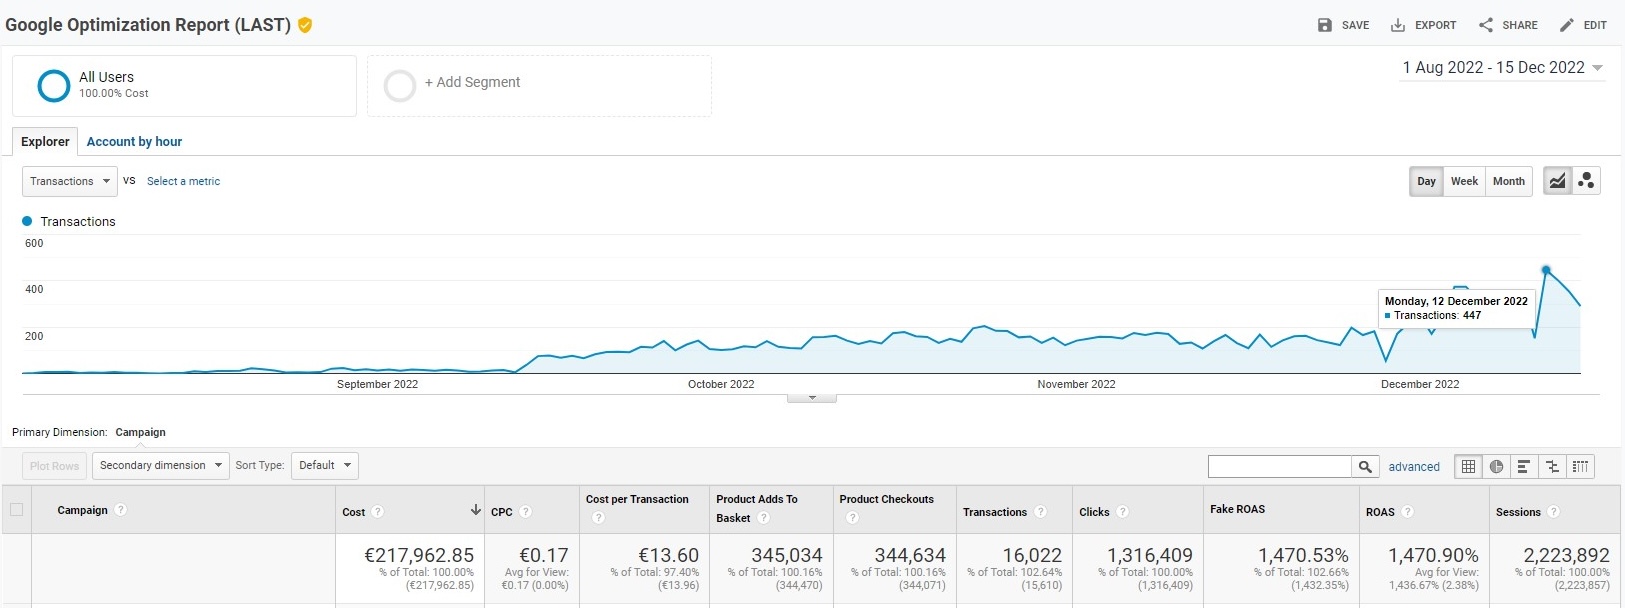
Fig 3 - 30 orders a day in August. 447 in a single day by December.
Daily transaction trend (GA4). August 2022: ~30 transactions/day. December 12, 2022: 447 in one day. Consistent upward trajectory accelerating into Q4. Same SKUs. Weekly bid reallocation routing budget to the top performers, compounding every cycle.
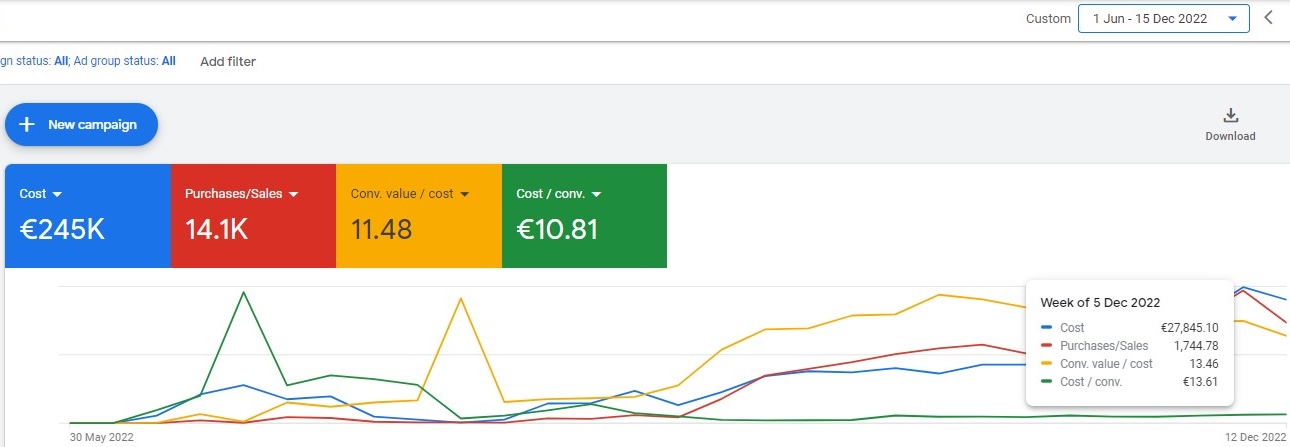
Fig 4 - Peak week · 5 Dec 2022 · 13.46× ROAS on €27.8K spend in seven days
Tooltip at the week of 5 Dec 2022. €27,845 spend, 1,744 purchases, 13.46× ROAS, CPA €15.97. Brand-search week peak inside the broader Sep–Dec scale phase (€241K spend, 13.05× ROAS at the period level). The peak is what four months of weekly bid reallocation compounding into Q4 looks like.
Catalogue + Shopping + post-migration mess sounds like your account? I'll tell you in 30 minutes what the rebuild would actually cost and how long it would take.
Book a 30-min diagnostic →Methodology
How to verify these numbers yourself.
Everything on this page is calculable from the screenshots above. Here's the math and what's intentionally hidden.
CPA is the headline number here, not just ROAS
Sneakit is a fashion marketplace, the business earns on transaction volume at thin margin, not on hero ROAS multiples. Google Ads CPA collapse from €30.32 to €9.80 is what made the model scale, same metric in both periods: Google Ads-attributed Purchase conversions only, native Google Ads attribution. Same account, more spend flowing in, platform CPA cut by two-thirds. That's the metric Smart Bidding optimises against, and that's the metric that pays the rent.
GA4 vs Google Ads, periods and attribution reconciled
Hero €3.2M is GA4 1 Aug – 15 Dec 2022: €217,962 spend reported, 14.7× ROAS, 16,022 Shopify transactions tracked. Fig 1 shows Google Ads native 1 Sep – 31 Dec 2022: €241K spend, 13.05× ROAS, CPA €9.80 (Purchase conversion only, Google Ads attribution). Two different reporting windows: the GA4 export was pulled mid-December, the Google Ads view covers the full quarter through 31 December including the Q4 holiday weeks 16–31 Dec, which is why Google Ads spend (€241K, full Sep–Dec) is higher than GA4 spend (€217K, Aug + partial Dec). Not a discrepancy, different cutoffs. Add the second attribution-model layer (Google Ads' broader click + view window vs GA4's stricter model) and that's the entire delta. Both screenshots are pulled directly from the platforms, every figure verifiable from the respective UI.
Account ownership visible in every screenshot
Every Google Ads screenshot shows account 'Sneakit EU' with an adpistols.com domain email visible top-right. GA4 reports from the same property. Timestamps Aug–Dec 2022.
What's intentionally not shown
The exact server-side container schema, custom Stape implementation details, feed transformation rules, and SKU-level bidding logic stay inside paying engagements. This page shows the outcome, the conceptual flow, and the verification math. My clients pay for that privacy.
What working with me looks like
From your first call to a Shopping account that compounds.
No deck, no procurement, no 6-month "discovery." This is what an engagement actually looks like, end to end.
Diagnosis & rebuild plan
Full audit: GA4, GTM, store backend, data layer, Shopping feed, GMC, all of it. Identify what's broken vs what just needs patching. Written scope with rebuild cost and timeline before any commitment.
Rebuild
Server-side tracking stack from scratch (custom setup using Stape as hosted infrastructure), Shopping feed restructured, SPAG campaign architecture rolled out across catalogue, GMC products fixed, bot filtering layer live.
Scale phase
Clean data feeds Smart Bidding immediately. Weekly bid reallocation routes budget to top performers. RLSA layers, day-of-week scripts, Q4 seasonal uplift. CPA collapses, ROAS holds, transaction volume compounds.
Ongoing or handoff
Continue as managed engagement OR full handoff documentation (architecture diagram, runbook, monitoring playbook) so your in-house team or any future operator can pick up. Your call.
Common questions before you book
The six things every e-commerce operator asks me first.
How long until I see results?
2-3 months. Sneakit baseline was May-Aug 2022 (broken tracking, 10.95× ROAS, €30.32 CPA). 60 days to rebuild the foundation, then Sep-Dec the CPA collapsed to €9.80 and revenue compounded into €3.2M. The pattern holds when the foundation is the bottleneck.
What if my Shopify is on a different setup (headless, plus, custom storefront)?
All setups possible. Custom pricing reflects actual complexity. Headless and migrated-off-Shopify cases like Sneakit are where this framework shines because the off-the-shelf solutions stop working at that complexity level.
What does the rebuild cost?
Depends on scope, never less than €6,000. The final number is a function of your scale, catalogue size, current infrastructure debt, and how much of the build is custom vs configurable. Scoped after the diagnostic, fixed price before any work starts. Premium positioning, not the cheapest option, but the math works at €10K+/month spend.
What if my current tracking still seems OK?
If you're talking to me about this it usually means your current tracking is not fully operational, even if your dashboard says otherwise. The first deliverable is a written diagnosis of what's actually being captured vs what's being lost. You decide what to do with that.
Do you work with our existing agency or replace them?
Both options work. I can co-pilot with your existing team (tracking + feed + Shopping infrastructure layer while they keep account management), or I can take over end-to-end. Tell me what model fits your operation.
What happens if we stop working together?
Full handoff and transition period. Architecture diagram, runbook, monitoring playbook, escalation contacts. Your in-house team or any future operator can pick up the work. Clients stay because they want to, not because they're locked in.
Operator's note
The Sneakit engagement ended in 2023 when Felix closed the company for reasons unrelated to ad performance. The infrastructure I built ran successfully for the full engagement window, every number on this page is from that window. What happened to the account after my exit ran on different team and different decisions, so it's not a fair comparison to the engagement period.
I've been running Google Ads, GMC, and server-side tracking for e-commerce since 2010. Fourteen years, 150+ accounts, €50M+ in managed spend. I know which Shopify migrations break tracking, which custom storefronts need which CAPI architecture, where the default Shopping setup leaves money on the table, and how to rebuild a foundation while the account is live without taking spend offline.
Tell me what your stack looks like, what got broken, and what you're trying to scale. I'll tell you whether the same framework applies, what it would cost to build, and what it would cost to keep running. No pitch.
What this case study doesn't show - and why
- Shopify backend revenue report, not available for publication. The €3.2M is GA4-tracked, the closest verifiable source.
- Individual campaign names, they contain product SKUs and margin signals the client treats as proprietary.
- Pre-engagement historical data, the account existed before this engagement but earlier screenshots weren't preserved.
"Marek is an exceptionally talented professional with a distinctive and commendable work ethic. His expertise and approach truly set him apart."

Sneakit · ecommerce · Upwork verified
Third-party verification
Verify independently, every claim is checkable.
Selective by design · 1-2 e-commerce engagements per quarter
Minimum engagement 3 months. Minimum spend €10K/month.
If you're above those numbers and your Shopping account is bleeding from broken tracking, broken feed, or a previous specialist's migration mess, three ways to start the conversation.
Path 1 · Self-serve
Shopping infrastructure diagnostic
90-second diagnostic for Shopify and post-Shopify e-commerce. Score your tracking, feed, and bidding foundation. No call required. Best when you want a fast read before booking my time.
Run the diagnostic →Path 2 · Paid · €1,500 fixed
Full Audit
Up to 3 marketing channels in one written report: structure, tracking, attribution, plus an AI opportunity layer. Delivered within 72 hours. No upsell.
See audit options →Path 3 · Direct
Strategy Call
30 minutes, your stack, your situation, honest answer on whether the framework applies and what it would cost.
Book the Call →Or email contact@adpistols.comwith your stack and what you're running into.